Q 1.
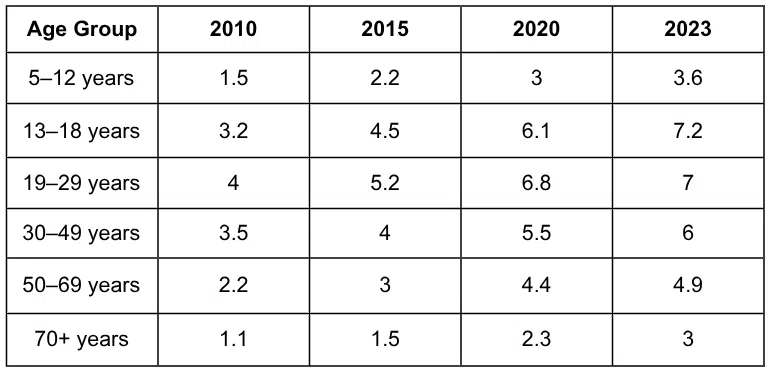
The average screen time for the age 13-18 in 2010 was 3.2 hrs/day, and the same was 7.2 hrs/day in 2023.
So, the total average screen time increase = 7.2 - 3.2 = 4
Increase % : 4/3.2 = 125%
The Statement is True.
Q2.
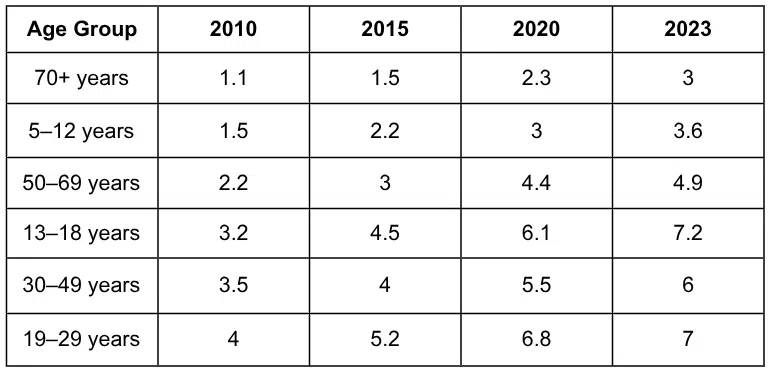
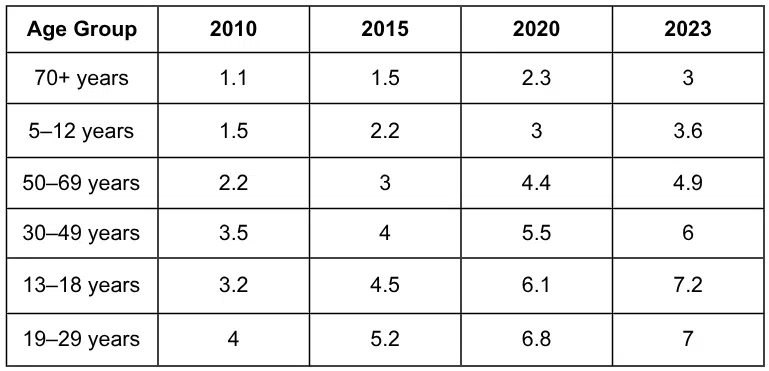
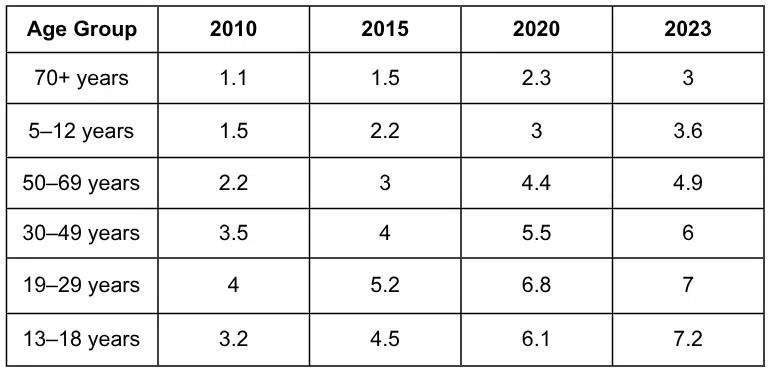
If there are equal numbers of people in each group, the median will be the mean of the middle two average usages when all are arranged in ascending order.
The middle two averages will be 4.4 hrs/day and 5.5 hrs/day.
So, the median will be $$\frac{\left(4.4\ +\ 5.5\right)}{2}=4.95$$ hours/day, which is less than 5 hours/day.
Hence, the statement is False.
Q3.
Average Screen time increase from 2010 to 2023 for the 30-49 age group: 6 - 3.5 = 2.5 hours/day
Average Screen time increase from 2010 to 2023 for the 50-69 age group: 4.9 -2.2 = 2.7 hours/day
The difference is less for the 30- 49 age group than for the 50-69age group.
Hence, the statement is False.